Private label shoes and bags factory - XINGZIRAIN

Wholesale Shoe Production from a Trusted Manufacturer

From the factory floor to your warehouse, I manage every detail of our shoe production to ensure consistent quality and on-time delivery for Wholesale orders. As a Manufacturer-focused partner, I guarantee scalable processes, precise sizing, and materials that balance comfort with durability. We offer end-to-end solutions: design support, sampling, rapid prototyping, and full production runs tailored to your demand. Our approach emphasizes traceability and compliance, so you can confidently scale your brand. I prioritize transparent communication, real-time production status, and flexible MOQs to suit your catalog. With vertical integration and rigorous QC, defects are caught early, saving you costs. We welcome Private Label and ODM opportunities, while still supporting Private Label clients who need reliable Wholesale channels. If you’re seeking a trusted Manufacturer to stabilize supply, reduce lead times, and drive margins, I’m here to align with your goals and deliver shoes that meet your market.


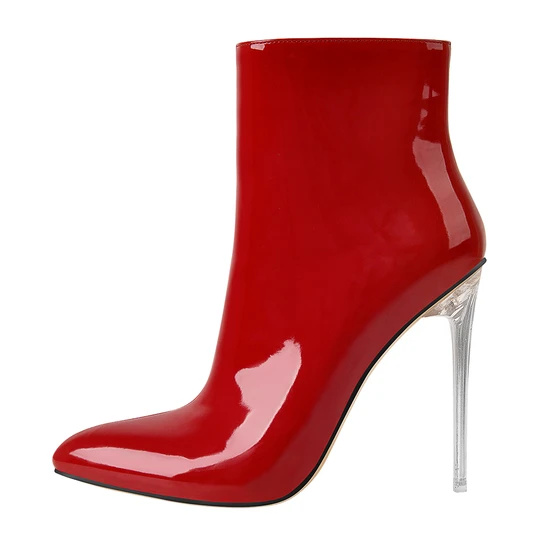
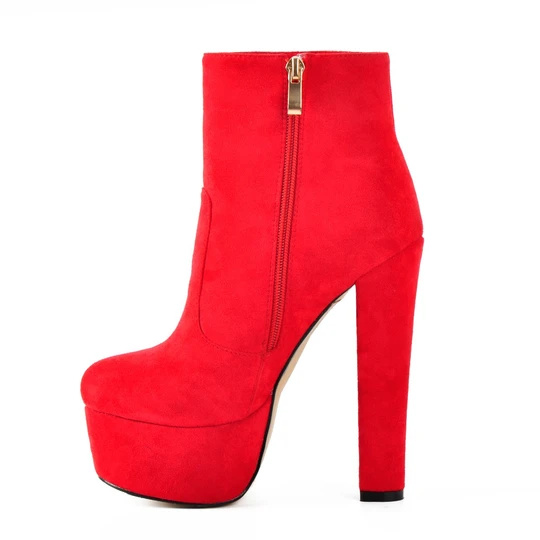
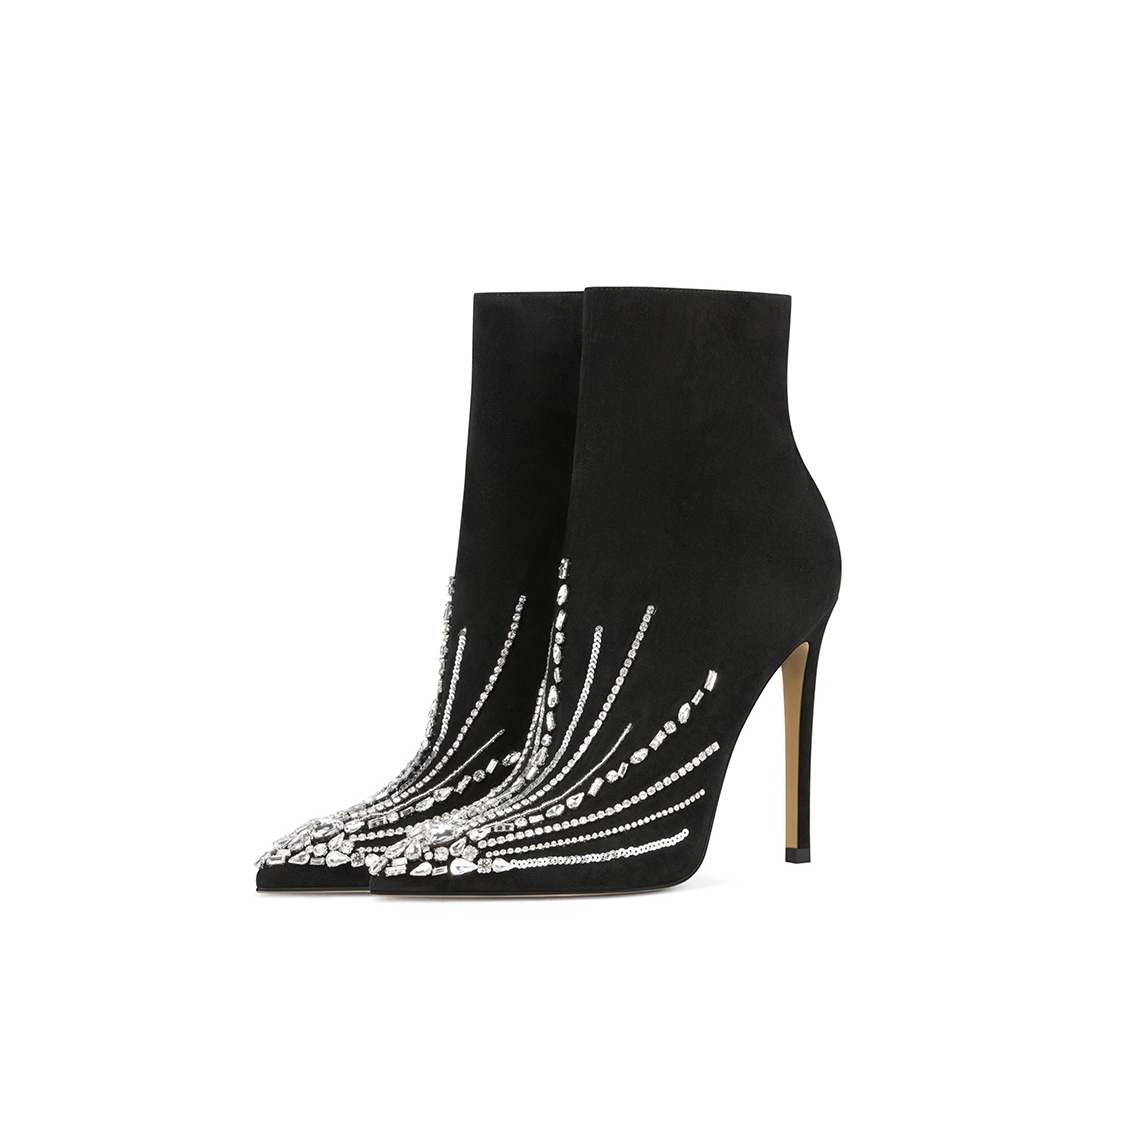
Hot Selling Product

shoe production Supplier From Concept to Delivery

From concept to delivery, a reliable footwear supplier offers an end-to-end journey for global buyers. A Chengdu-based partner provides design support, material selection, and prototyping with in-house CAD, 3D modeling, and rapid tooling. We turn ideas into tangible samples—from last development to upper and sole integration—accelerating iterations and ensuring fit, comfort, and regional compliance. On the manufacturing floor, scalable capacity and strict QC deliver consistent results from pilot runs to mass production. The workflow covers tool making, cutting, sewing, molding, finishing, and rigorous inspections, with clear metrics and sustainable packaging. Export-ready packaging and coordinated logistics secure on-time delivery to worldwide customers, supported by transparent communication and continuous improvement.

shoe production Supplier From Concept to Delivery
Supplier ID Country/Region Factory Size (sqm) Lead Time (days) Monthly Capacity (pairs) MOQ (pairs) Primary Materials Tooling Status QA Pass Rate (%) On-Time Delivery Rate (%) Certifications Energy per Pair (kWh)
S-1001 Vietnam 12000 28 320000 5000 Leather upper, EVA midsole, Rubber outsole Completed 99.2 97.5 ISO 9001; ISO 14001 0.85
S-1002 China 18000 32 520000 8000 Synthetic mesh upper, TPU midsole Completed 98.7 96.2 ISO 9001 0.92
S-1003 Portugal 8000 25 150000 3000 Canvas upper, Rubber outsole In Progress 98.6 97.3 ISO 9001; BSCI 0.72
S-1004 Indonesia 6000 21 120000 2000 Knit upper, EVA midsole Completed 99.4 99.0 ISO 9001 0.68
S-1005 Mexico 9000 26 180000 3500 Synthetic leather, Rubber outsole Completed 97.5 96.8 ISO 9001 0.71

Related Products

shoe production Ahead of the Curve Sets the Industry Standard

Data Dimension: Throughput Efficiency and Lead Time by Quarter

Explanation: This dataset presents a pragmatic view of throughput efficiency and lead time across a calendar year in a generic shoe production line. Throughput efficiency is captured as the daily output relative to nominal capacity, while lead time is the average duration from order receipt to finished shoe, expressed in days. The chart uses monthly data to show how improvements in automation, line balancing, and preventive maintenance can push throughput upward while reducing cycle time. In the early months, throughput increases steadily as equipment utilization improves; lead times are comparatively longer due to startup variability, raw-material delays, and ramp-up inefficiencies. As the year progresses, maintenance scheduling becomes more predictive and line changeovers become faster, producing a clear upward trajectory in monthly outputs and a concurrent downtrend in lead time. The dual-axis configuration is intentional: throughput and lead time live on different scales, so a single-axis view would obscure the relationship between capacity and responsiveness. The left y-axis emphasizes output volume, while the right y-axis traces the pace of fulfillment. Together, they reveal how heightened production pace can coexist with shorter lead times when processes are synchronized and bottlenecks are addressed.

From a strategic perspective, the chart demonstrates the industry’s forward path toward “Ahead of the Curve” standards: robust data collection, real-time monitoring, and adaptive scheduling. When throughput climbs but lead time remains stubbornly high, it signals bottlenecks in downstream processes (e.g., packaging or QA) that warrant targeted interventions. Conversely, simultaneous growth in throughput and drop in lead time indicates a well-balanced, resilient operation. The metrics can guide investment decisions, such as scaling automation, enhancing supplier reliability, or implementing modular production lines to preserve agility. In summary, this data-rich view helps manufacturers quantify progress, set realistic targets, and drive continuous improvement toward industry-leading performance in both capacity and responsiveness. The overarching message is clear: data-driven optimization in shoe production can set or elevate industry standards by delivering higher output with faster, more reliable delivery times.

Top Selling Products

Leave Your Message