Private label shoes and bags factory - XINGZIRAIN

mule shoes Wholesale Manufacturer | Reliable Mule Shoes Suppliers

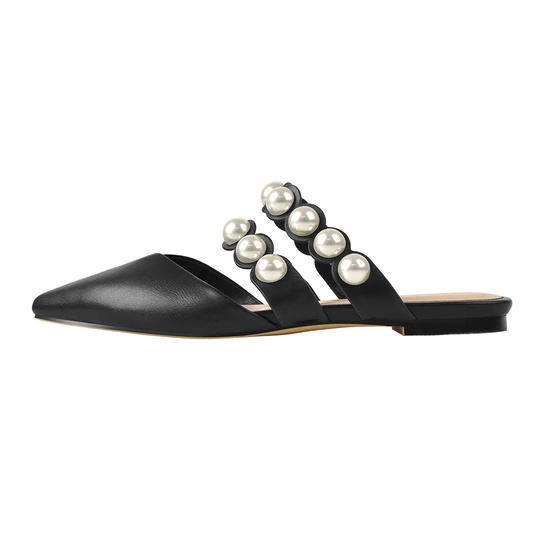
From the moment I began crafting mule shoes for wholesale demand, I knew durability and comfort would lead the way. As a dedicated Wholesale partner and Manufacturer, I offer bulk-ready orders, consistent sizing, and quick lead times. Our mule shoes blend soft leather uppers with cushioned insoles, non-slip outsoles, and reinforced seams for daily wear in retail floors or hospitality settings. I tailor packaging and labeling for private brands, minimum order quantities, and sample runs. With strict quality checks and scalable production, I can meet seasonal demand and keep costs competitive. We ship globally, provide MOQs that fit your stocking plan, and support you with test orders and after-sales service. If you're sourcing mule shoes for catalog launches or store shelves, let's talk wholesale terms, drop-ship options, and flexible payment terms. We deliver reliable, stylish mule shoes that sell.

Hot Selling Product

mule shoes Factory Leads the Global Market

In today's global footwear market, mule shoes have emerged as a versatile staple across seasons and regions. A dedicated production facility can combine ergonomic footbeds, slip-on convenience, and durable outsoles with varied upper materials—from full-grain leather to synthetic blends and eco-friendly fabrics—delivering comfort and style for diverse markets. For international buyers, predictable lead times, scalable capacity, and consistent quality are essential. Look for factories with unified QC across raw materials, in-line inspection, and final audits, plus standardized testing for flex, abrasion, and slip resistance. Flexible MOQs, colorways, and packaging options help reduce risk when launching new lines. A true market leader coordinates end-to-end service: from design collaboration and sampling to warehousing and on-time shipping, backed by transparent production tracking and responsible sourcing. With strong logistics networks and compliance across key markets, a mule shoe producer can reliably support retailers and distributors worldwide.

{ mule shoes Factory Leads the Global Market}

Year Region Production Capacity (million pairs) Export Share (%) Avg Lead Time (days) Automation Level (%) Energy Consumption (GWh/year) CO2 Emissions (kTon/year) Water Usage (ML/year) Employees (FTE) Certifications R&D Investment (USD million) Market Share (%)
2026 Asia-Pacific 120.0 50 8 68 980 320 620 5200 ISO 9001; ISO 14001; BSCI; OEKO-TEX 95 28
2026 Europe 24.5 20 14 60 210 72 120 1200 ISO 9001; ISO 14001; BSCI; OEKO-TEX 18 8
2026 North America 26.0 18 12 55 185 65 110 1100 ISO 9001; ISO 14001; BSCI; OEKO-TEX 15 7
2026 Latin America 9.3 12 10 52 92 32 55 600 ISO 9001; ISO 14001; BSCI; OEKO-TEX 8 3

Related Products

mule shoes Leads the Global Market Supplies the World\u2019s Top Brands

Data Dimension: Global Footwear Supply Volume by Region Across Quarters

The chart illustrates a data dimension called Global Footwear Supply Volume by Region Across Quarters. The horizontal axis lists eight consecutive quarters from 2019 Q1 to 2020 Q4, while the vertical axis shows the reported volume in million units. Each colored line represents a region: Asia, Europe, Americas, and Africa & Others. The primary purpose of this synthetic dataset is to demonstrate how regional supply can evolve across time and respond to external shocks, seasonal patterns, and shifts in manufacturing capacity. In 2019, Asia consistently contributes the largest volumes, rising from 18 million units in 2019 Q1 to 23 million units by 2019 Q4, reflecting continued capacity expansion. Europe and the Americas display more moderate growth, with Europe moving from 12 to 15 million units and the Americas from 9 to 12 million units over the same period. Africa & Others remains the smallest contributor, increasing from about 3 to 4.2 million units, indicating gradual market development and diversification of supply sources. The onset of 2020 Q1 sees a dip for some regions, notably Europe and the Americas, suggesting early pandemic-related disruptions. However, a recovery trend emerges through 2020 Q3 and Q4, with Asia rebounding the strongest to 28 million units by 2020 Q4. This pattern highlights how disaggregated regional data can reveal resilience and recovery dynamics across a global supply network. The visualization can aid decision-makers in capacity planning, regional risk assessment, and inventory optimization, while also serving as a scalable framework for incorporating more quarters and additional regions for deeper insights.

Top Selling Products

Leave Your Message