
Sneaker Manufacturing: Wholesale from a Trusted Manufacturer
On the factory floor and in the design studio, I lead Sneaker Manufacturing with a simple aim: quality, speed, and real value for Wholesale buyers and Manufacturer partners. I handle end-to-end ODM and OEM projects—from concept, prototyping, and fit testing to scalable production and global distribution. Our facilities flex from jogging sneakers to performance runners, using choice leather, fabrics, carbon rubber, and sustainable uppers to match your price tier. I implement rigorous QA, material traceability, and lab tests to meet international standards, ensuring consistent size runs and color accuracy. Turnaround times are predictable, and MOQs are configurable to your demand, with transparent pricing for Wholesale orders. With transparent communication, flexible packaging, and compliant supply chains, I remove the risk of sourcing. If you’re seeking a reliable Manufacturer who can partner with your brand and accelerate time-to-market, I’m ready to talk details and deliver samples.


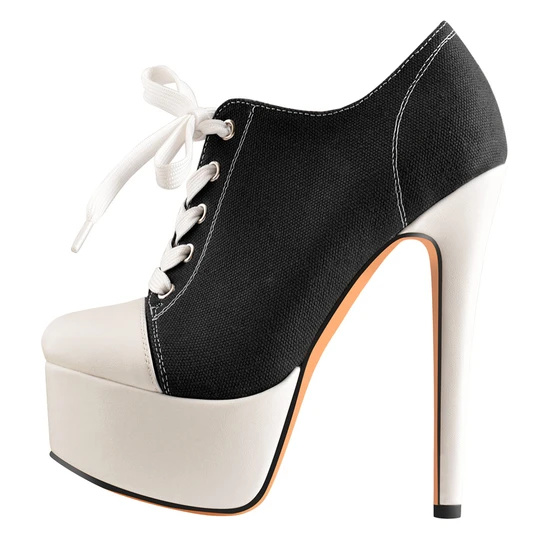
Sneaker Manufacturing Stands Out Your Trusted OEM Partner
In the fast-moving world of athletic footwear, an OEM partner that can translate concepts into consistent, scalable products stands apart. From design support and rapid prototyping to tooling, material selection, and full-scale production, a trusted sneaker manufacturer delivers end-to-end service. Global buyers value rigorous quality management, in-line inspection, and traceable sourcing, backed by automation and standardized processes that reduce lead times and ensure on-time delivery across regions. Beyond engineering excellence, a dependable partner offers transparency and protection for every project: confidential design handling, private labeling, flexible MOQs, and packaging customization. They prioritize sustainable materials, ethical manufacturing, and certifications to meet regional requirements. With multi-site capacity, resilient supply chains, and global logistics options, they support smooth sampling, mass production, and after-sales QA, helping buyers scale with confidence while safeguarding IP and brand integrity.
| Metric | Description | Value | Unit | Benchmark / Notes |
|---|---|---|---|---|
| Production Capacity | Maximum number of sneaker pairs produced per day in standard operation | 540 | pairs/day | Industry typical: 450–520; target: ≥ 550 |
| Lead Time | Average order lead time from receipt to shipment | 12 | days | Best-in-class: 9–10 days |
| Cycle Time | Average assembly line cycle time per pair | 2.1 | minutes | Target ≤ 2.5 minutes |
| Defect Rate | Defects detected during final inspection | 0.9 | % | Benchmark ≤ 1.0% |
| Scrap Rate | Material scrap during cutting and prep | 0.6 | % | Benchmark ≤ 0.8% |
| On-Time Delivery (OTD) | Delivery performance in last quarter | 96 | % | Industry avg: 93–97% |
| Water Usage | Water usage per pair during manufacturing | 1.8 | L/pair | Target < 2.0 L/pair |
| Energy Consumption | Energy usage per pair | 0.27 | kWh/pair | Target ≤ 0.3 kWh/pair |
| Labor Productivity | Pairs produced per worker per day | 65 | pairs/worker-day | Benchmark ≥ 70 |
| Materials Yield | Adherence of primary materials to spec | 0.97 | ratio | Benchmark ≥ 0.95 |
| Certifications | Quality and management system certifications | 2 | count | ISO 9001; ISO 14001; optional IATF 16949 |
| Customer Returns | Return rate in last quarter | 1.2 | % | Benchmark ≤ 1.5% |
Related Products






Sneaker Manufacturing Ahead of the Curve Winning in 2025
Top Selling Products






- Related Blog
- Reviews
- Reviews
