
Glitter Sandals Wholesale - Manufacturer Direct for Retailers
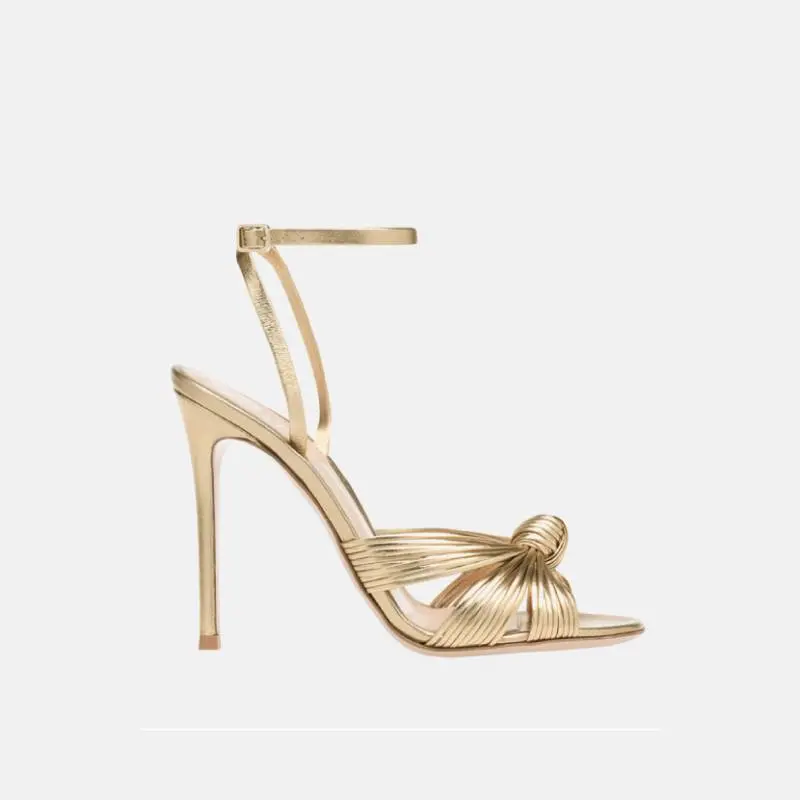
From the workshop to your catalog, I bring Glitter Sandals that shine without breaking margins. I’m a Manufacturer who works directly with retailers, offering Wholesale opportunities and flexible MOQs. These sandals feature glitter straps, cushioned footbeds, and a durable outsole for all-day wear. I provide reliable lead times, competitive pricing, and steady stock across seasons. Partnering with me means product photography, quality tests, and ready-to-display packaging, ideal for catalogues, online marketplaces, or boutique stores. I design for fast-moving classics and trend-led drops that attract fashion-forward customers seeking affordable sparkle. Available in multiple colors, sizes, and private-label options, my Glitter Sandals fit private branding, shelf-ready displays, and mixed-store assortments. If you’re a retailer seeking a dependable Wholesale supply chain and a responsive Manufacturer, let’s discuss your target volumes and private-label possibilities.


Glitter Sandals Supplier More Than a Supplier - A Partner
In a crowded market, a glitter sandals supplier becomes a true partner when they move beyond transactional fulfillment to collaborative value creation. For global buyers, the goal is to build a supply chain that scales with demand, adapts to trends, and protects margins. From concept to shipment, we offer end-to-end support: rapid sampling, materials (synthetic glitter, vegan leather, recycled fabrics), customizable uppers, soles, and packaging. Flexible MOQs and transparent lead times, plus rigorous QC, ensure consistent quality. We also support private labeling and branding while meeting deadlines. As a partner, you gain resilience: proactive production planning, real-time order tracking, and responsive after-sales service. We support seasonal co-creations, cost optimization, and reliable shipments to retailers and online platforms worldwide. If you seek a sourcing partner that adds strategic value, let's explore the possibilities.
| KPI | Description | Value | Unit | Last Updated | Notes |
|---|---|---|---|---|---|
| Lead Time | Average production lead time after order confirmation | 12 | days | 2026-07-28 | Standard styles; seasonal variances apply |
| On-Time Delivery | Orders delivered on or before promised date | 97 | % | 2026-07-28 | Rolling 12-month average |
| Defect Rate | Percentage of units failing QA upon final inspection | 0.8 | % | 2026-07-28 | Includes batch rework rate |
| MOQ (Minimum Order Quantity) | Minimum quantity per order | 100 | units | 2026-07-28 | Flexibility for sampling orders |
| Monthly Production Capacity | Maximum production capacity per month | 450000 | pairs | 2026-07-28 | Based on standard line efficiency |
| Materials & Construction | Key materials and construction outline | PU upper; Glitter PVC overlay; EVA midsole; TPR outsole | - | 2026-07-28 | Eco-friendly coatings; colorfast glitter |
| Certifications & Compliance | Industry certifications and compliance | ISO 9001; REACH; CPSIA | - | 2026-07-28 | CSR and factory audit standards |
| Sample Lead Time | Time to produce and ship a sample pair | 7 | days | 2026-07-28 | Includes courier transit |
| Sustainability Score | Internal sustainability assessment (0-100) | 86 | /100 | 2026-07-28 | Based on materials, energy, waste management |
| Global Coverage | Regions served | 5 | regions | 2026-07-28 | NA, EU, APAC, MEA, LATAM |
| After-sales Support | Support availability and SLA | 24/5 | hours | 2026-07-28 | Email, chat, phone |
| Warranty Coverage | Warranty period for product quality | 12 | months | 2026-07-28 | Manufacturing defect coverage |
Related Products






Glitter Sandals Guarantees Peak Performance Your End-to-End Solution
Top Selling Products






- Related Blog
- Reviews
- Reviews
