
Wholesale Heels Manufacturer | Leader in Heels Manufacturing
I’m a heels manufacturer dedicated to helping retailers and brands scale with confidence. As a partner in Wholesale and private-labeled programs, I offer consistent quality, fast lead times, and flexible MOQs. My workshop combines premium materials—full-grain leather, suede, and durable synthetics—with precise stitching and sustainable production practices. I design and manufacture a wide range of styles, from block-heel pumps to stilettos and ergonomic fits, all crafted to comfort, lift, and durability. I can customize heel height, lining, colorways, packaging, and branding to fit your catalog. Each batch undergoes stringent QA, size grading, and test wear to minimize returns. I support efficient logistics, competitive wholesale pricing, and transparent communication—so you can meet seasonal demand, private-label, or exclusive lines. If you’re seeking a reliable supply chain and a true partner in Manufacturer capabilities, let’s talk about your next collection.





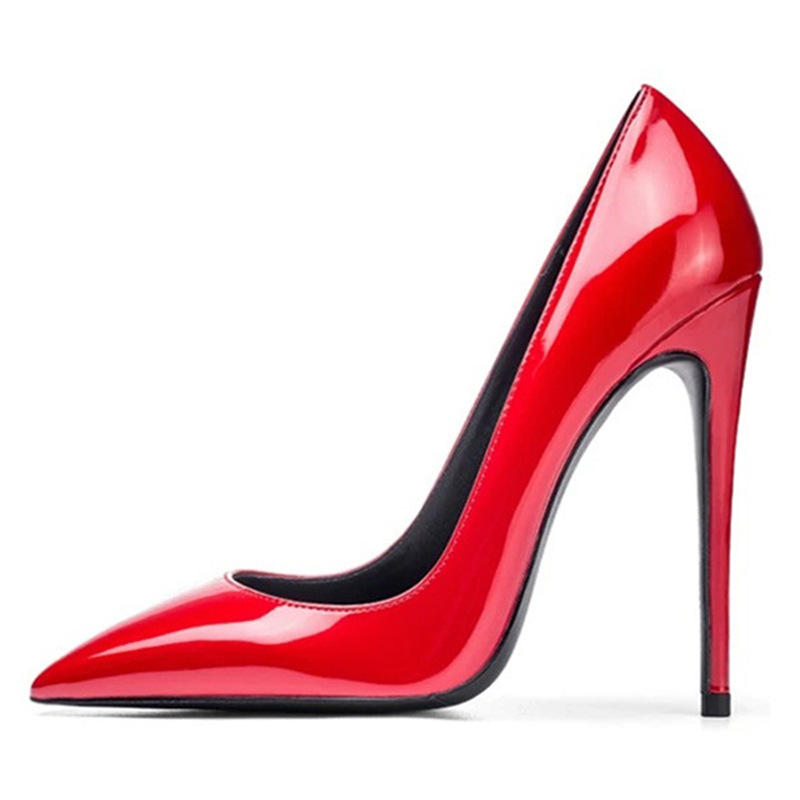
heels manufacturer Where Service Meets Innovation Outperforms the Competition
Global buyers want more than stylish heels; they seek a partner whose service blends with constant innovation. A top manufacturer offers end-to-end collaboration—from concept and design to sourcing, sampling, and on-time production. An in-house R&D team uses CAD/CAM and rapid prototyping to tailor silhouettes, heel heights, comfort features, and finishes for diverse markets. A robust quality system guarantees material traceability, rigorous QC, and compliance with international standards. Flexible MOQs, scalable production lines, and transparent logistics keep programs responsive to trends and volume changes. Where service meets innovation, buyers gain predictable quality and costs. Close planning, dashboards, and dedicated support keep programs on track, with a fast sample-approval cycle. Automation, lean processes, and digital QC cut lead times and waste while lowering total cost. Sustainable materials and packaging address growing demand for responsibility. Partnering with this kind of supplier minimizes risk and speeds market entry.
| Factory ID | Region | Certifications | Lead Time (days) | On-Time Delivery (%) | Defect Rate (%) | Monthly Capacity (k pairs) | Material Quality Score | Service Innovation Index | Warranty (months) | After-Sales Response Time (hours) |
|---|---|---|---|---|---|---|---|---|---|---|
| Factory-01 | East Asia | ISO 9001, ISO 14001, BSCI | 18 | 96 | 0.8 | 860 | 88 | 91 | 24 | 6 |
| Factory-02 | Europe | ISO 9001, ISO 14001, BSCI, SEDEX | 24 | 92 | 1.1 | 700 | 85 | 88 | 24 | 8 |
| Factory-03 | North America | ISO 9001, ISO 45001, SA8000 | 15 | 98 | 0.4 | 1120 | 93 | 97 | 36 | 3 |
| Factory-04 | South Asia | ISO 9001, BSCI, WRAP | 28 | 89 | 1.3 | 700 | 82 | 80 | 12 | 18 |
| Factory-05 | Southeast Asia | ISO 9001, ISO 45001, SEDEX | 16 | 94 | 0.9 | 860 | 89 | 85 | 24 | 7 |
| Factory-06 | Africa | ISO 9001, ISO 45001 | 22 | 90 | 1.0 | 520 | 78 | 82 | 18 | 14 |
Related Products






heels manufacturer Factory Winning in 2025
Top Selling Products




- Related Blog
- Reviews
- Reviews
