Private label shoes and bags factory - XINGZIRAIN

Walking Heels Wholesale | Trusted Manufacturer for Walking Heels

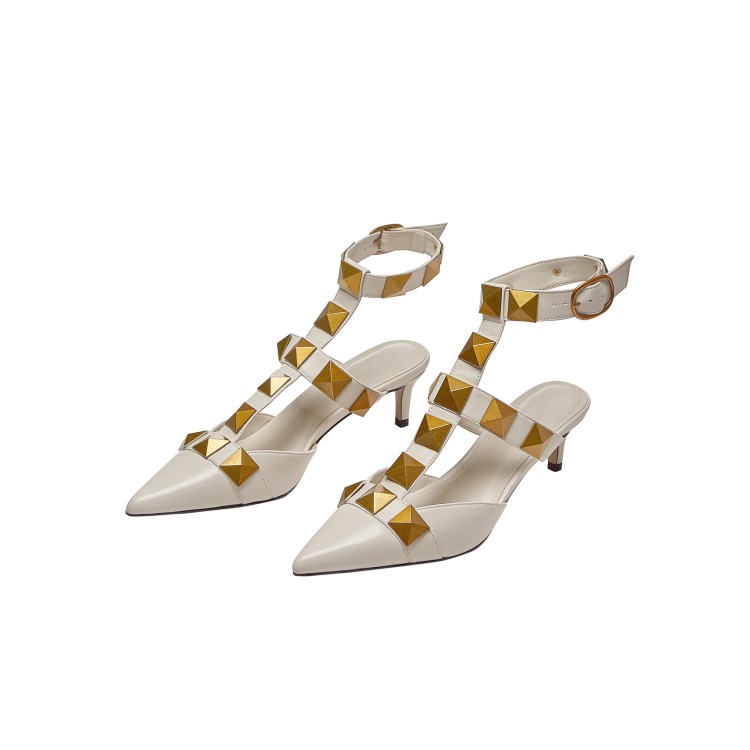
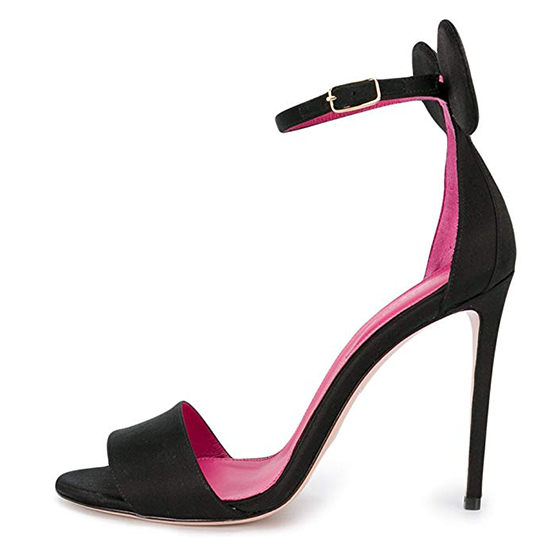
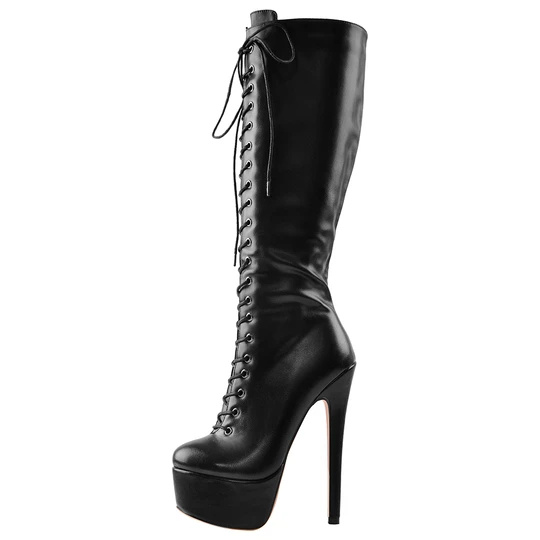
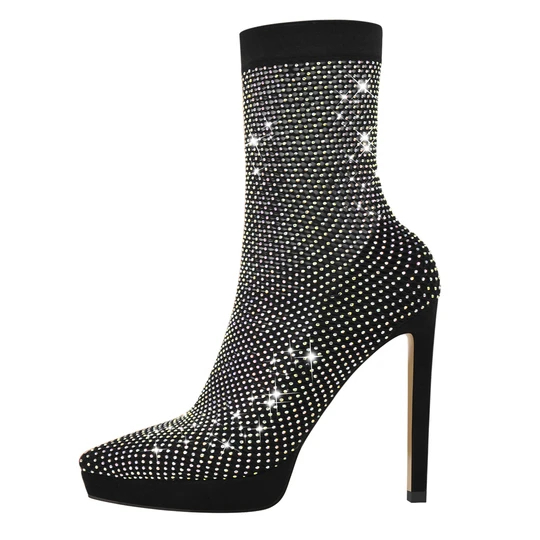
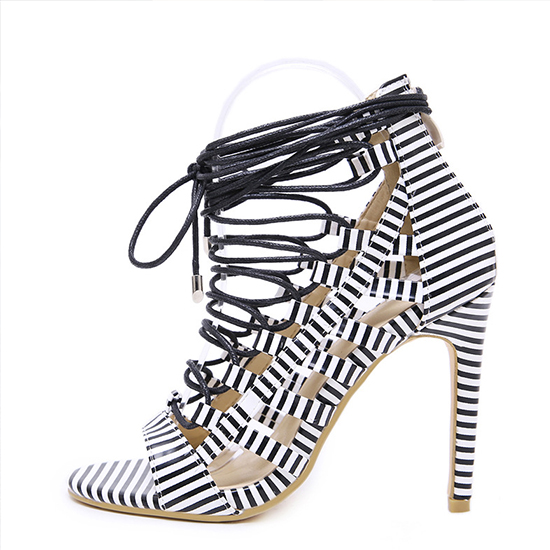
We craft walking heels that blend comfort and professional style for wholesale buyers. As a dedicated Manufacturer, I offer flexible options for Wholesale orders, from bulk pricing to private labeling. Our walking heels feature a supportive cushioned footbed, balanced heel height, and slip-resistant outsole to keep you comfortable through long days. I focus on quality control and reliable supply so your shelves stay stocked and your customers stay happy. For retailers and corporate programs, I provide customization, packaging choices, and on-time delivery that meet your branding needs. I understand the buyer's mind: easy lead times, transparent pricing, and responsive service. Send me your bulk order details, and I’ll propose the best walking heels solution for your catalogue. Together we can grow your business as your trusted Wholesale Manufacturer partner, with practical designer details and durable materials that perform in real work settings.

Hot Selling Product

walking heels Supplier Service Backed by Expertise

Global buyers seeking long-lasting walking heels will find a Chengdu-based manufacturer whose service is powered by deep product expertise. From concept to mass production, the team blends ergonomic design, durable materials, and rigorous QA to ensure comfort, stability, and style. A well-controlled supply chain and in-house tooling shorten lead times and safeguard consistency across styles and sizes. Offering end-to-end solutions, the supplier supports ODM and private-label projects, customizing heel height, uppers, colors, outsole grip, and comfort features. Prototyping is fast, with flexible MOQs and scalable lines that adapt to seasonal demand. Testing for wear, slip resistance, and colorfastness helps buyers approve with confidence. Global procurement benefits extend beyond product quality: transparent project management, real-time updates, and reliable logistics ensure on-time delivery to multiple regions. A focus on traceability, sustainability, and ethical manufacturing reduces risk for international buyers seeking responsible, high-performance walking heels.

{ walking heels Supplier Service Backed by Expertise}
Region Years of Expertise Certifications Service Types Lead Time (Days) MOQ (Units) Monthly Capacity (Pairs) Quality Rating Design Support Industries Served
North America 12 ISO 9001; ISO 14001 Customization, Rapid Prototyping 22 200 5200 4.6 Yes Apparel; Footwear; Luxury Goods
Europe 15 ISO 9001; ISO 13485 End-to-end Product Development; Material Sourcing 28 150 6400 4.8 Yes Medical; Sportswear; Footwear
Asia-Pacific 9 ISO 9001 Customization; Prototyping 18 100 9800 4.5 No Casual Shoes; Children's Footwear
Latin America 11 ISO 9001; ISO 45001 Mass Customization; Quality Assurance 25 300 3900 4.4 Yes Workwear; Athletic Footwear
Middle East 8 ISO 9001 Sourcing; Quality Control 35 400 3200 4.2 No Outdoor; Sandal Manufacturing
Africa 10 ISO 9001 Logistics Integration; After-sales Support 30 250 2100 4.3 Yes School Shoes; Safety Footwear

Related Products

walking heels Manufacturer Sets the Industry Standard

New Data Perspective: Operational Efficiency Index by Quarter

Dimension: Operational Efficiency Index by Quarter

This chart presents a data perspective called the Operational Efficiency Index (OEI) by quarter, a composite indicator designed to track how efficiently a footwear manufacturing line operates over time. The OEI blends four core drivers: throughput (units per hour), quality yield (defect-free rate), on-time delivery, and energy per unit. Each quarter aggregates these signals into a single score on a 0–100 scale, where 100 represents optimal efficiency. The dataset covers twelve quarters from Q1 2020 to Q4 2022 and shows a general upward trajectory with seasonal and program-related fluctuations. The steady rise from about 62 at the beginning to the mid-80s at the end suggests that a series of process improvements—such as shorter changeovers, workspace reconfiguration, and selective automation—have translated into more consistent output and better resource use. The smaller dips, for example around Q3 2020 and Q2 2021, reflect transition phases, supplier adjustments, or temporary demand shifts that temporarily tempered performance. The chart emphasizes that OEI is a high-level summary; while helpful for quick assessment, it benefits from decomposition. Analyzing components separately can reveal whether efficiency gains came primarily from throughput, quality, or energy management. For instance, if OEI rises with a stable defect rate, the gain likely stems from faster production lines; if the defect rate also improves, quality initiatives are contributing as well. In practice, teams can use this visualization to align improvement roadmaps across manufacturing, maintenance, and engineering. It also highlights that comparisons across plants require consistent normalization and methodology, as differing line configurations can affect the absolute index. Periodic recalibration of the weighting scheme ensures the OEI remains a meaningful barometer of continuous improvement. Overall, the chart demonstrates how data-driven metrics can bring clarity to complex manufacturing dynamics and support targeted, evidence-based decision making.

Top Selling Products

Leave Your Message