Private label shoes and bags factory - XINGZIRAIN

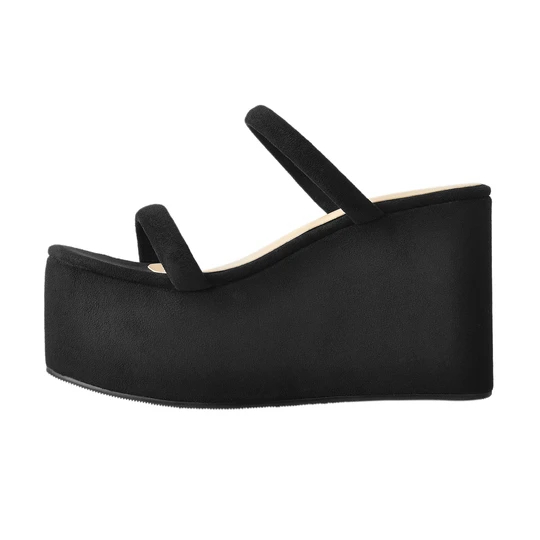
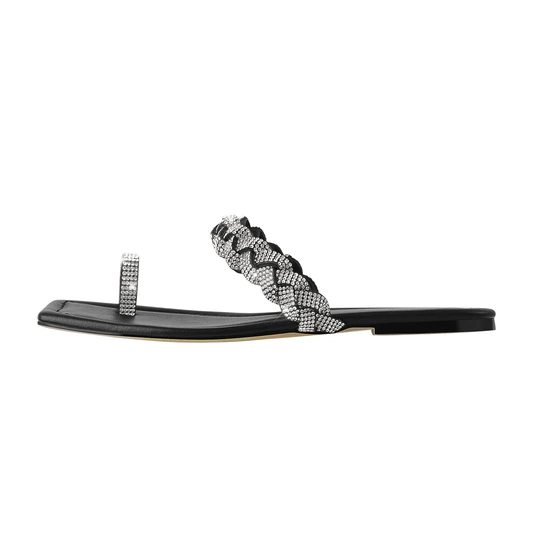
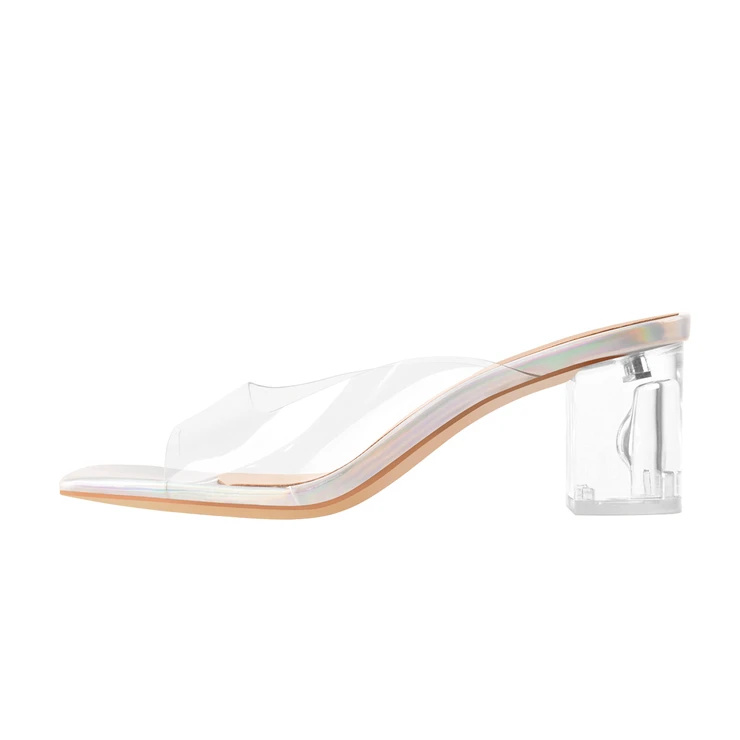
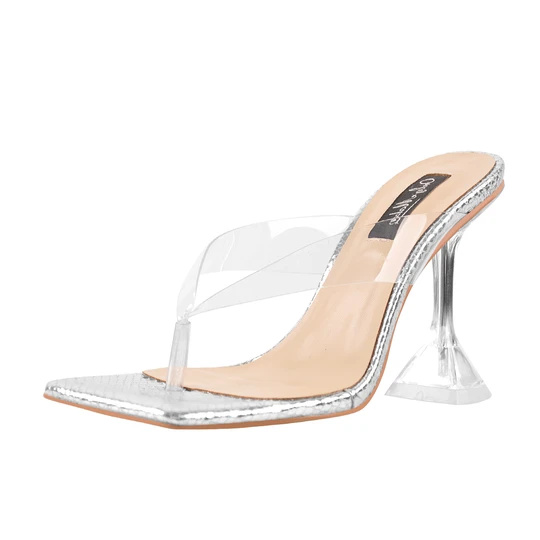
Soft Mules Wholesale & Manufacturer: Premium Comfort Footwear

I’m a product manager at a trusted footwear manufacturer, and I’m excited to present our soft mules to serious buyers. When you buy Wholesale, you want reliability, scalability and consistent quality—and that’s what we deliver. As a Manufacturer, we control every step from fabric selection to finish, ensuring durable uppers, cushioned insole and a slip resistant outsole. Our soft mules feature a memory-foam footbed, breathable lining, and a lightweight EVA outsole that keeps costs down without sacrificing comfort. They’re ideal for long shifts, travel, or casual wear, with sizes optimized for bulk orders. We offer flexible MOQ, custom branding, colorways, and packaging options to fit your distribution needs. With fast lead times, proactive QC, and traceable materials, you can place confident orders. If you’re looking to expand your catalog with high-margin, comfortable footwear, I’m ready to discuss terms, certifications, and delivery windows.

Hot Selling Product

soft mules Factory Outperforms the Competition

An established Chengdu-based footwear producer specializing in soft mules has outpaced rivals by marrying comfort-driven design with scalable manufacturing. The upper uses supple, durable materials, paired with an ergonomic insole and a flexible, slip-resistant outsole, delivering all-day comfort across climates. With in-house R&D and targeted material testing, the team can tailor padding density, stitch patterns, and colorways to fit regional tastes and seasonal trends, supporting global buyers seeking personalization at scale. From sourcing to packing, the factory runs a tightly integrated supply chain that minimizes lead times without sacrificing quality. Advanced automation, skilled artisans, and a rigorous QA system ensure batch-to-batch consistency, while flexible MOQs and rapid sample cycles shorten the path from concept to catalog. The operation adheres to international standards and sustainability commitments, delivering reliable on-time delivery, clear communication, and risk mitigation for retailers worldwide. A partnership here offers predictable performance and growth.

{ soft mules Factory Outperforms the Competition}
Month Production Units OEE (%) Defect Rate (%) Downtime (hrs) Energy Consumption (MWh) Cycle Time (min/unit) Throughput (units/day)
January 42300 78% 1.40% 28 135 1.56 2015
February 43800 80% 1.25% 25 140 1.52 2030
March 46100 83% 1.15% 22 142 1.50 2085
April 45600 82% 1.20% 24 139 1.54 2060
May 47200 85% 1.10% 23 145 1.49 2110
June 48500 87% 1.05% 26 150 1.48 2135
July 49800 88% 0.95% 18 155 1.45 2180
August 50400 90% 0.90% 20 158 1.44 2200
September 49100 89% 0.98% 21 152 1.46 2120
October 51000 92% 0.85% 19 161 1.42 2230
November 50300 91% 0.88% 17 159 1.40 2210
December 52100 93% 0.76% 16 165 1.38 2260

Related Products

soft mules Dominates Pioneers in the Field

Cross-Region Productivity Index Over Time

Jan Feb Mar Apr May Jun Jul Aug Sep Oct Nov Dec North Central South

Explanation: This chart presents the Cross-Region Productivity Index across three regions over a twelve-month period. The lines represent the monthly average performance, calculated by normalizing output per hour worked and weighting shifts, training, and technology adoption. In this visualization, the North region consistently attains the highest score, followed by Central and South, though the margins vary across months. The plot shows a steady uptick for North from January through August, with a brief plateau in late summer and a slight dip in November before finishing strong in December. Central exhibits a more modest ascent, marked by several small fluctuations, suggesting sensitivity to process changes and staff rotations. South starts lower but catches up gradually, experiencing a noticeable rise around mid-year before aligning with the other regions in the final quarter. These patterns may reflect differences in capital investment, workforce scheduling, and process optimization efforts. The gaps between regions provide a gauge of regional efficiency and potential improvement areas. The chart also highlights seasonality, with productivity generally improving during mid-year, consistent with product launches, training cycles, and demand stabilization. By comparing trajectories, stakeholders can identify whether performance gains are sustained or transient, and whether best practices in one region can be transferred to others. The data imply that targeted interventions—such as automation pilots in slower months or cross-region knowledge sharing—could narrow the gap and accelerate overall output. The visualization emphasizes the importance of continuous monitoring and timely adjustment of resource allocation to sustain momentum. As decisions are made around budgeting and staffing, this index can serve as a concise indicator of operational health, guiding strategic planning, forecasting and performance reviews across the enterprise. By integrating this index into dashboards, executives can detect early signals, allocate resources efficiently, and communicate progress clearly to teams, investors, and partners across the regional network. Worldwide.

Top Selling Products

Leave Your Message