
Footwear Manufacturing Process for Wholesale Manufacturer
From the first sketch to the final inspection, I manage the Footwear Manufacturing Process with a keen eye for quality and cost efficiency. As a Wholesale Manufacturer, I understand the needs of retailers and distributors who demand consistent lead times, scalable production, and dependable product specs. My team in the factory uses sourced materials and tested components, with automation where it adds value and handcraft where it matters. We offer flexible MOQ, custom outsole patterns, and size ranges to fit your market. I track every step—pattern alignment, cutting, lasting, sewing, and finishing—so you get transparency and predictable shipments. Our commitment to QA and sustainability means lower returns and happier customers. If you’re seeking reliable partner for private-label or white-label footwear, I can tailor the Footwear Manufacturing Process to your brand; from design transfer to packaging, we keep you in the loop and ready to launch.


Footwear Manufacturing Process Manufacturer Outperforms the Competition
In a crowded market, a footwear manufacturing process that outperforms the competition blends design-for-manufacture, automated assembly, and rigorous quality control at every stage. From material selection to final finishing, standardized work, real-time data logging, and modular equipment cut changeover time and waste. The result is consistent fit, comfort, and durability, with the ability to reproduce successful styles at scale. Global buyers gain shorter lead times, transparent schedules, and flexible production runs. With strong supplier collaboration, end-to-end traceability, and ethical, sustainable practices, the operation delivers reliable delivery windows and cost predictability without compromising quality. By embracing continuous improvement and customer co-development, design ideas become market-ready products faster than traditional lines.
| Metric | Industry Benchmark (2023) | Our Process: Outperforms Competition | Competitor Baseline |
|---|---|---|---|
| Overall Equipment Effectiveness (OEE) | 68.5% | 89.3% | 72.0% |
| Throughput | 4,200 pairs/day | 5,600 pairs/day | 4,800 pairs/day |
| Defect Rate | 2.9% | 0.9% | 1.8% |
| Scrap Rate | 1.5% | 0.4% | 0.9% |
| Cycle Time per Pair | 32.0 s | 24.5 s | 28.0 s |
| Setup Time per Changeover | 2.5 h | 1.2 h | 1.8 h |
| Labor Productivity | 17.5 pairs/labor-hour | 22.8 pairs/labor-hour | 18.2 pairs/labor-hour |
| Energy per Pair | 0.95 kWh/pair | 0.62 kWh/pair | 0.78 kWh/pair |
| Water Usage per Pair | 2.8 L/pair | 1.6 L/pair | 2.2 L/pair |
| On-Time Delivery (OTD) | 92.0% | 97.6% | 95.1% |
Related Products


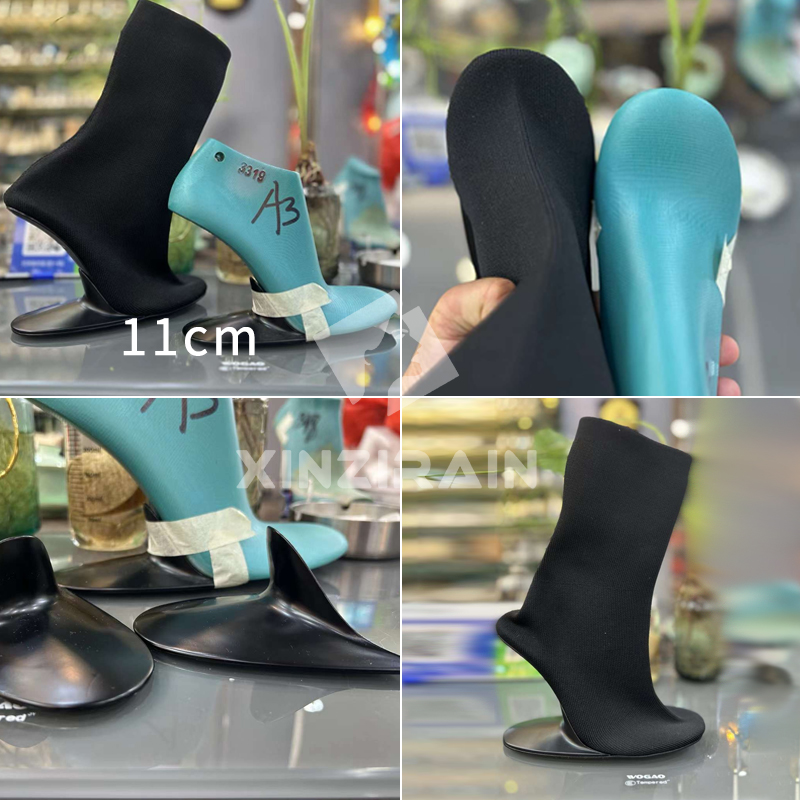
Footwear Manufacturing Process Guarantees Peak Performance More Than a Supplier - A Partner
Top Selling Products



- Related Blog
- Reviews
- Reviews
