
Custom High Heel Factory - Wholesale & Manufacturer Solutions
I’m your go-to Custom High Heel Factory for wholesale orders and OEM manufacturing needs. We specialize in turning your heel designs into ready-to-ship products with consistent fit and finish. As a manufacturer, I coordinate every step—from sourcing premium uppers, adhesives, and outsole compounds to stitching, padding, and lining—so you get durable, fashion-forward heels at scale. We offer flexible MOQs, competitive pricing, and fast lead times to keep your catalog fresh. You’ll appreciate our design support, including pattern grading, size ranges, and material customization, plus rigorous QA at every stage. For wholesale partners, I provide transparent pricing, private labeling, and dependable logistics to meet seasonal demand. For manufacturers exploring private label, we deliver repeatable production processes and clear documentation. Let's align on specs, timelines, and packaging so your brands shine. Reach out today and we’ll tailor a plan that fits your market.




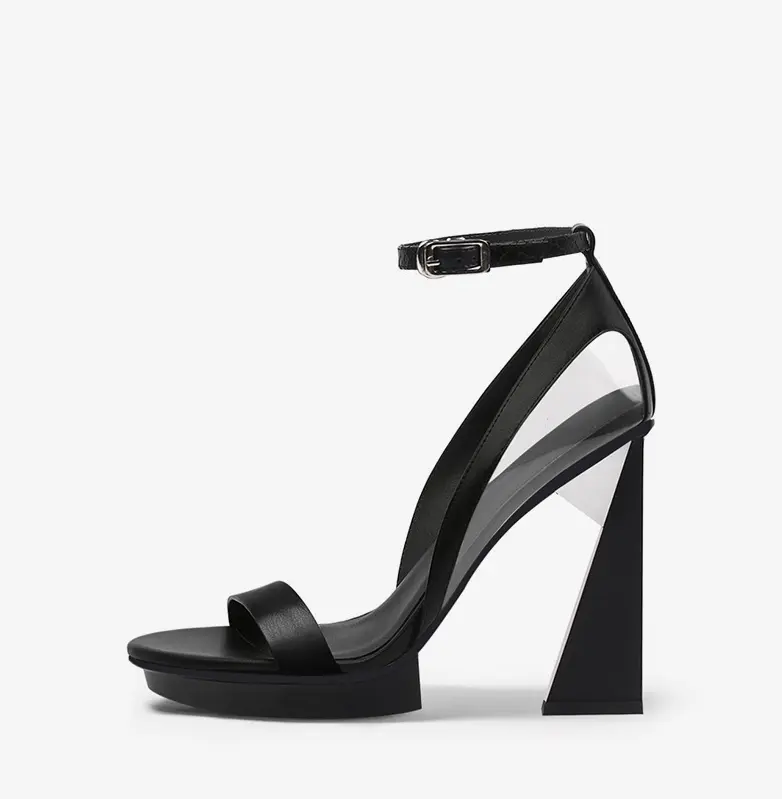
Custom High Heel Factory in 2025 Your End-to-End Solution
By 2025, the best custom high-heel factories blend design freedom with seamless manufacturing, turning bold ideas into market-ready footwear fast. An end-to-end partner starts with collaborative design, rapid prototyping, and pattern development, then moves to material selection, heel and outsole engineering, and tooling. Buyers can specify silhouette, heel height, toe shape, cushioning, lining, hardware, and private labeling, while receiving transparent costings and realistic lead times. From samples to scale, the facility handles sourcing, cutting, lasting, assembly, finishing, and packaging under tight quality control. Real-time production planning, in-line inspections, and final audits ensure consistency. Flexible MOQs, sustainable material options, and compliant practices offer IP protection and reliable delivery, supported by order tracking and responsible packaging. This end-to-end solution helps global buyers accelerate go-to-market with durable, stylish heels.
Custom High Heel Factory in 2025 Your End-to-End Solution
| Metric | Description | Value | Unit | Year / Source | Trend |
|---|---|---|---|---|---|
| Monthly Production Capacity | Maximum finished pairs produced per standard calendar month for custom orders | 15,000 | pairs/month | 2025 / Plant IoT data | Increasing |
| Lead Time for Custom Orders | Average time from order confirmation to shipment | 21 | days | 2025 / ERP systems | Decreasing |
| Defect Rate | Percentage of units with defects in final inspection | 0.9 | % | 2025 / QA data | Decreasing |
| Average Order Processing Time | Time to process a new custom order in order management | 3 | days | 2025 / Ops | Decreasing |
| Leather Material Usage per Pair | Leather usage for upper part per pair | 0.30 | meters/pair | 2025 / Materials planning | Stable/Decreasing |
| Energy Consumption per Pair | Energy used on average to produce one pair | 3.5 | kWh/pair | 2025 / Plant IoT data | Decreasing |
| Labor Hours per Pair | Labor hours required to produce one pair | 0.50 | hours/pair | 2025 / Time studies | Decreasing |
| Scrap Rate | Scrap percentage during production | 4.0 | % | 2025 / QA data | Decreasing |
| On-time Delivery Rate | Percentage of orders delivered on or before agreed date | 95.0 | % | 2025 / Logistics | Increasing |
| Automation Level | Share of processes automated in manufacturing | 65 | % | 2025 / OEE reports | Increasing |
| Downtime Percentage | Unscheduled downtime as a share of scheduled production time | 6.5 | % | 2025 / Plant IoT | Decreasing |
| Materials Waste per Week | Raw material waste generated weekly | 40 | kg/week | 2025 / Materials accounting | Stable |
Related Products


Custom High Heel Factory Dominates Manufacturers You Can Rely On
Top Selling Products
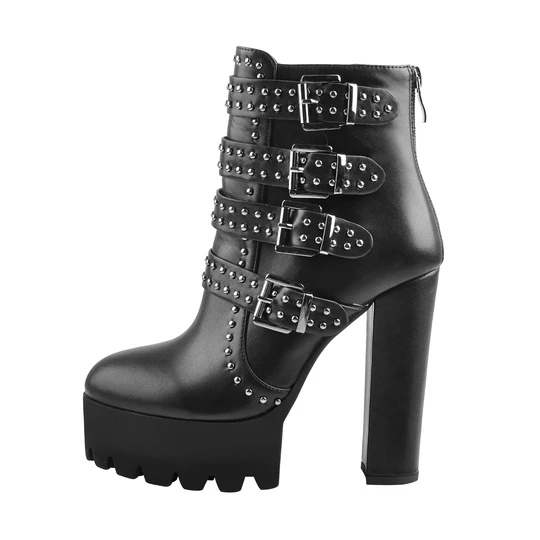
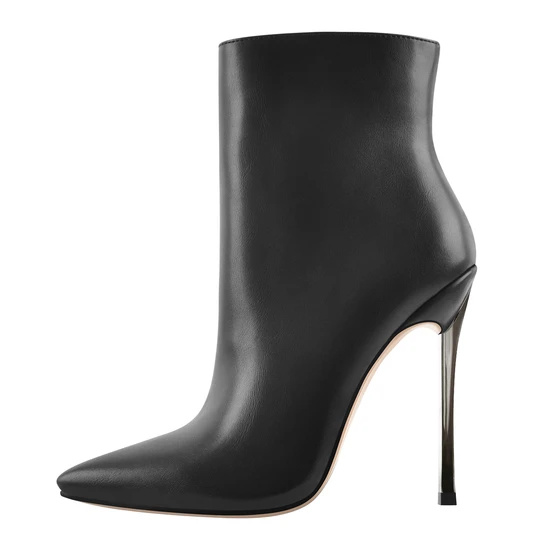
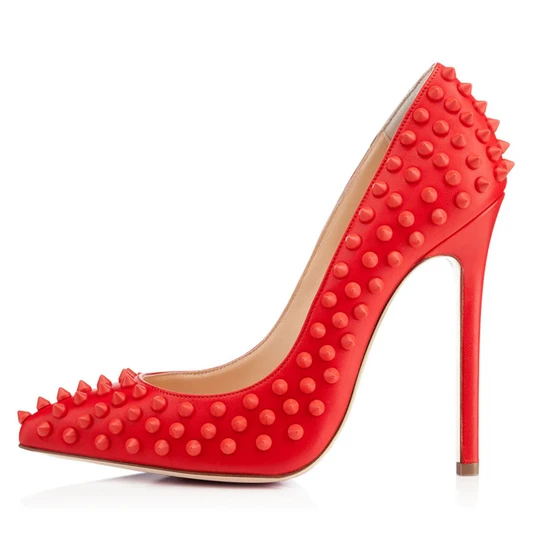





- Related Blog
- Reviews
- Reviews
