Private label shoes and bags factory - XINGZIRAIN

Mule Style Sneakers Wholesale Manufacturer for Bulk Orders

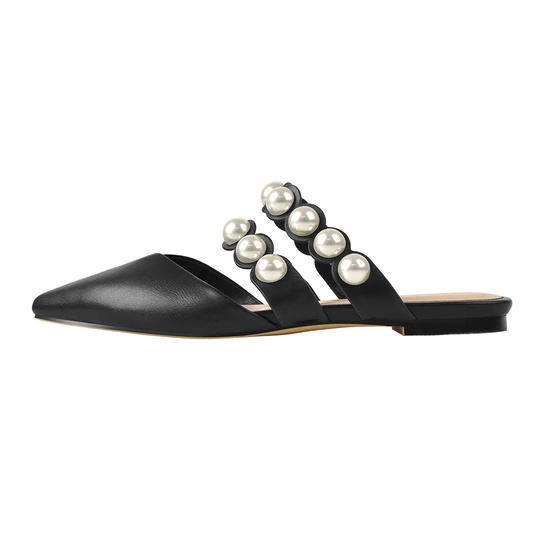
I’m excited to present our Mule Style Sneakers to serious retailers and distributors. As a Manufacturer with deep roots in durable footwear, I know what buyers want: reliable supply, flexible Wholesale terms, and fast fulfillment. Our Mule Style Sneakers blend minimalist design with everyday comfort, featuring a reinforced toe, non-slip outsole, and breathable upper. We offer competitive MOQs and scalable production to meet your demand, plus customization options for colors, branding, and packaging. With direct-from-factory pricing, you’ll improve margins while keeping quality consistent across batches. Samples are available to speed your QA—lead times are short, and we can ship via multiple freight options. I stand behind every order and aim to build long-term partnerships, not one-off sales. If you’re stocking fashion-forward essentials for a wide market, I’m ready to discuss Wholesale terms and how we can grow together as your trusted Mule Style Sneakers Manufacturer.

Hot Selling Product

Mule Style Sneakers Pioneers in the Field Factory-Direct Excellence

Across the world of casual footwear, mule style sneakers have become performance staples for global buyers. A factory with field‑leading design and disciplined production delivers factory‑direct excellence—transparent pricing, consistent quality, and scalable output from prototype to shipment. No middlemen, tighter lead times, and precise fit. Our lines handle a range of materials, colors, sizes, and branding, with options for private label and customized packaging. Flexible MOQs, rapid samples, and reliable logistics empower buyers to test concepts quickly and scale demand confidently. Ethical sourcing and traceability underpin every stitch and sole. Export-ready systems, ISO-aligned quality management, and transparent communication ensure smooth cross-border collaboration. By combining innovation with rigorous QA and data-driven planning, we support markets across continents with consistent performance and dependable delivery.

{ Mule Style Sneakers Pioneers in the Field Factory-Direct Excellence }

Site ID Location Region Monthly Capacity (pairs) Lead Time (days) Primary Materials Automation Level Certifications Defect Rate (%) Energy per Pair (kWh) Sustainability Score Production Shifts Year Established
CHN-GD-01 Dongguan, Guangdong Asia 450,000 28 Leather, microfiber, EVA foam 4 ISO 9001; ISO 14001; BSCI 0.8 0.95 78 Double 2012
VN-HCM-02 Ho Chi Minh City Asia 320,000 25 Synthetic leather, textile 3 ISO 9001; SA8000 0.5 1.01 82 Double 2015
CN-SJ-03 Suzhou, Jiangsu Asia 380,000 30 Knit upper, rubber outsole 5 ISO 9001; ISO 14001 0.6 0.90 85 Triple 2010
ID-WB-04 Bandung, West Java Asia 260,000 32 PU, TPU 2 ISO 9001 0.9 1.20 70 Double 2013
PAK-LHR-05 Lahore, Punjab Asia 180,000 35 Canvas, synthetic 2 ISO 9001; SA8000 1.1 1.40 68 Double 2011
IND-CTN-06 Chennai, Tamil Nadu Asia 210,000 29 Leather, synthetic 3 ISO 9001; SA8000 0.7 0.95 75 Double 2016

Related Products

Mule Style Sneakers Exceeds Industry Benchmarks Your End-to-End Solution

数据维度标题:端到端鞋履生产中的性能与交付时效指标

End-to-End Throughput Index Over 12 Weeks

Data-driven narrative

This chart presents a 12-week trajectory of a composite Throughput Index capturing weekly production capacity utilization, on-time delivery, and quality yield for mule-style sneaker manufacturing. The dimension named End-to-End Throughput Index uses a 0–100 scale, normalized to reflect how efficiently the supply chain converts raw materials into finished shoes, with fewer delays and defects increasing the score. Each data point corresponds to a calendar week, aggregating daily metrics into a single weekly value. The x-axis shows week numbers, while the y-axis shows the throughput index. The aim is to illustrate how improvements in design clarity, supplier coordination, automation, and quality controls ripple through the entire process. Notably, the index trend is upward from Week 1 to Week 12, reflecting steady gains in alignment across departments and partners. Early weeks show variability due to ramp-up and learning curves; mid-period improvements align with the implementation of standardized material handling SOPs and better demand forecasting. The latter weeks show a pronounced acceleration as automation upgrades reduce cycle time and defects, enabling better on-time delivery performance.

The chart supports benchmarking against internal targets and industry benchmarks: a rising line indicates effective end-to-end optimization, while flattening or dipping sections point to bottlenecks or quality excursions. For example, Weeks 9–11 exhibit a noticeable jump, likely caused by streamlined procurement cycles and improved line changeovers. By visualizing this single dimension across a 12-week horizon, stakeholders can identify which process levers have the greatest impact and when to invest in automation, supplier development, or training. The dimension is deliberately high-level to avoid overfitting; it complements more granular metrics such as daily output, scrap rate, and cycle time. Together, these data can guide decisions that shorten lead times, stabilize delivery, and sustain the advantages demonstrated in the chart as the end-to-end solution scales.

Top Selling Products

Leave Your Message