Private label shoes and bags factory - XINGZIRAIN

Strap Sandals Wholesale Manufacturer - Durable Fashion Footwear

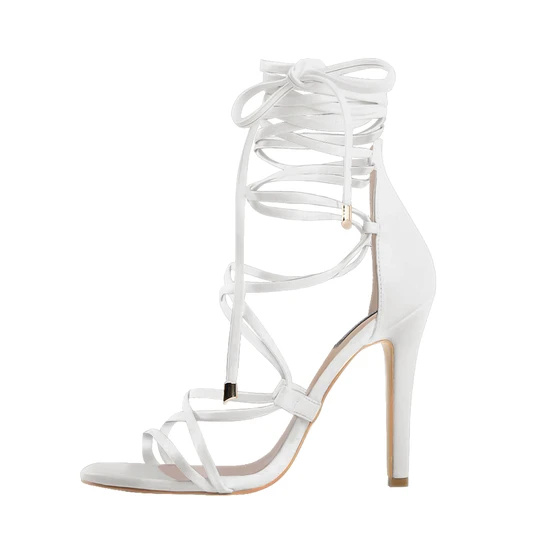
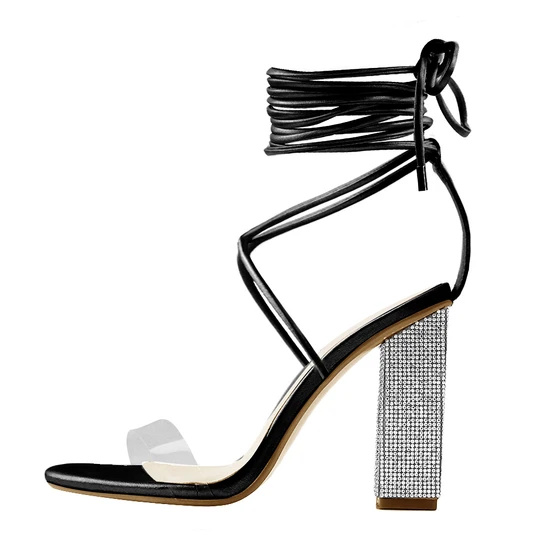
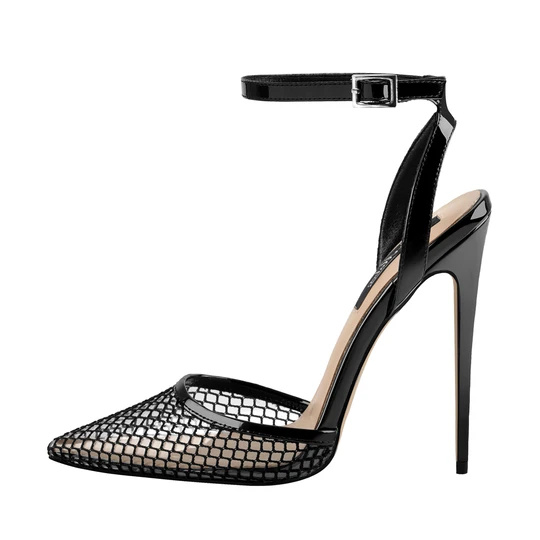
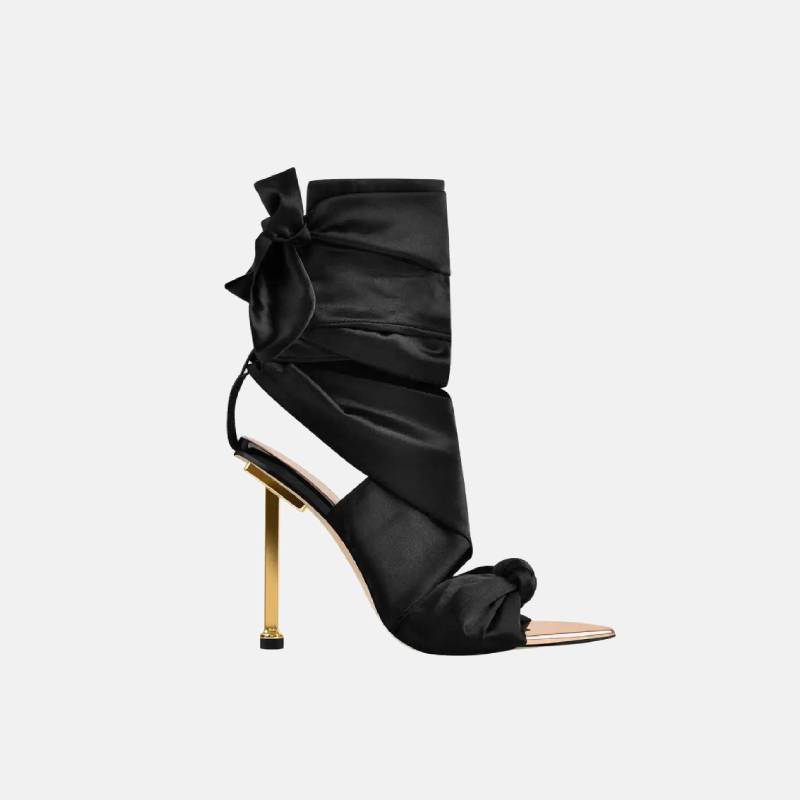
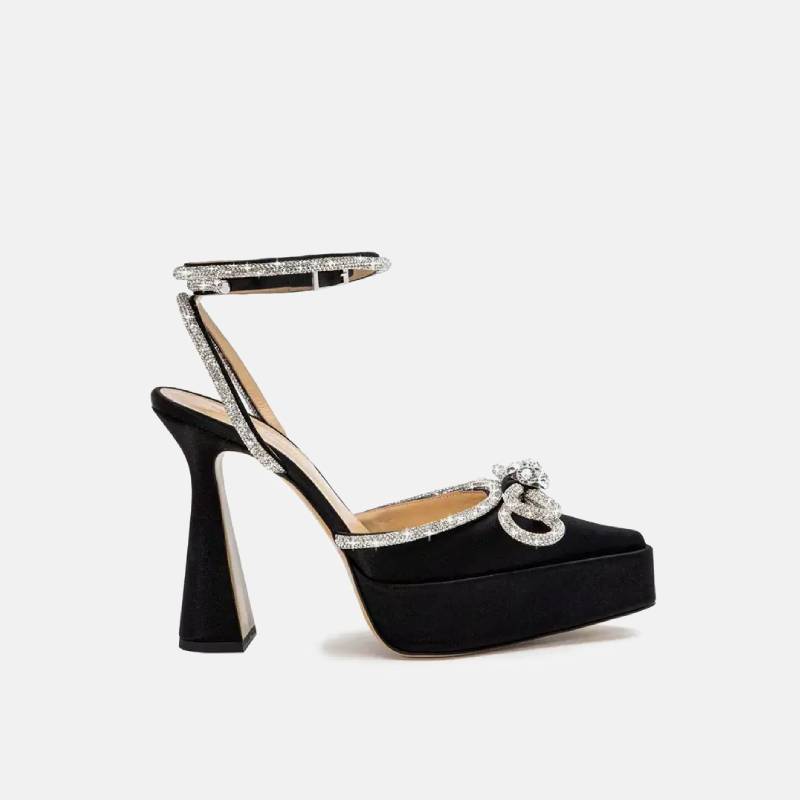
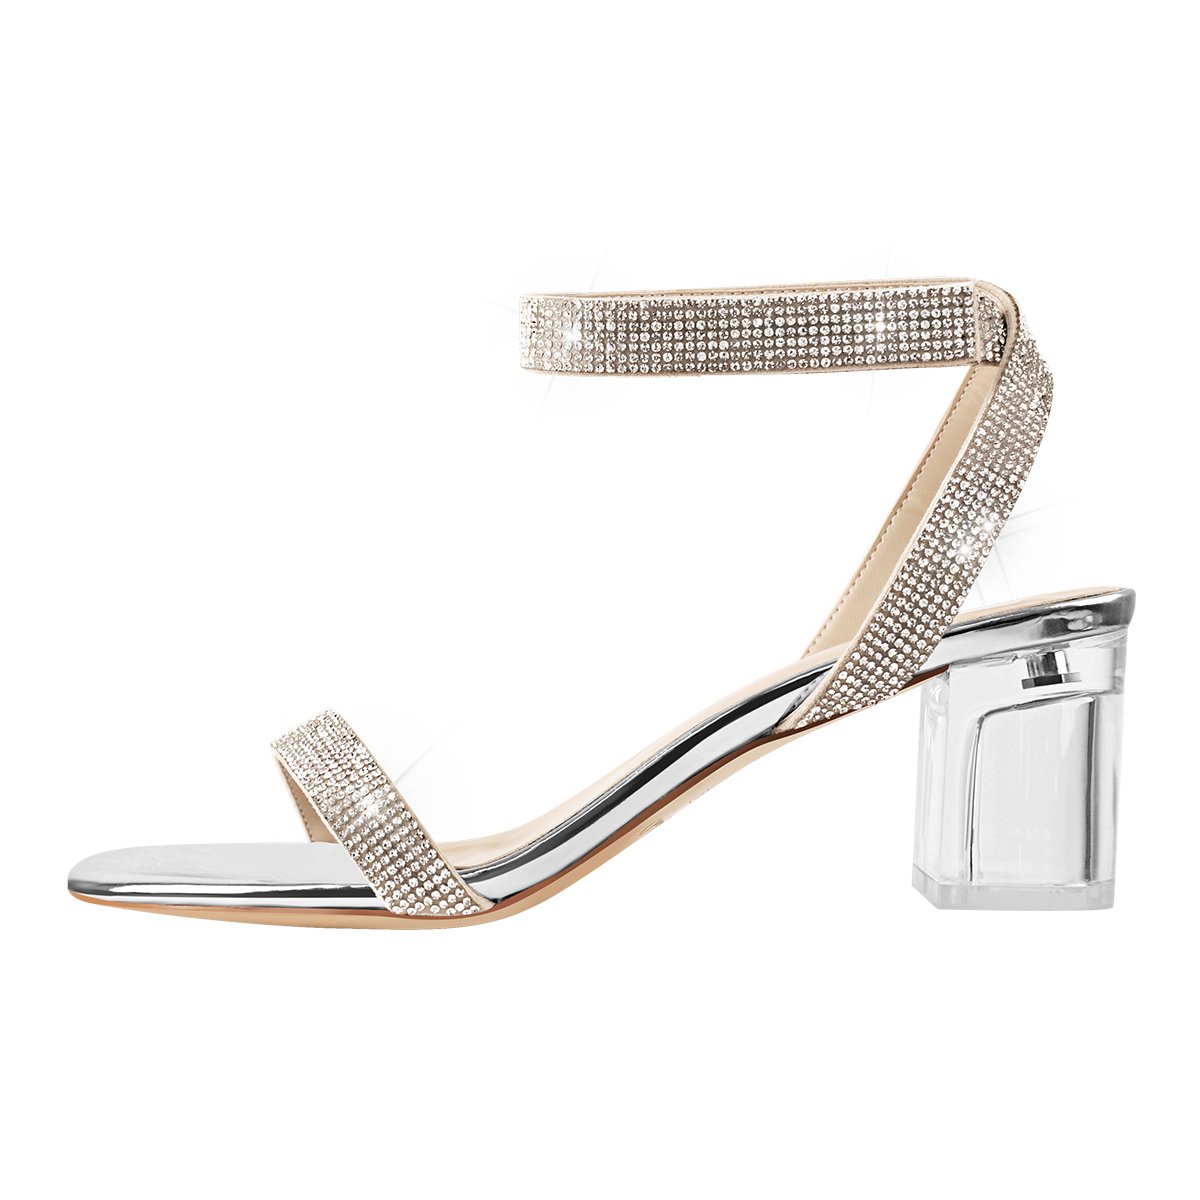
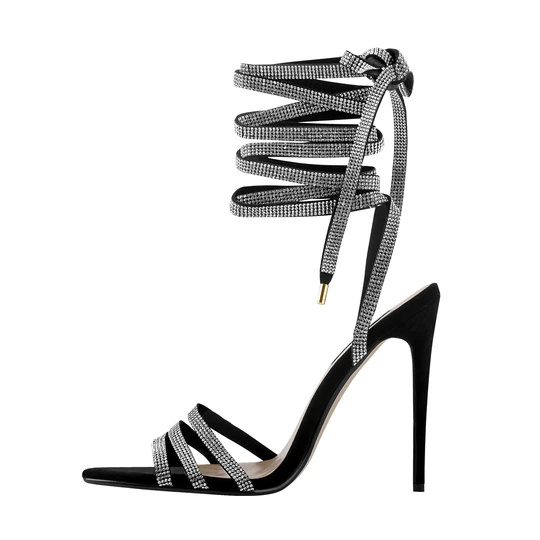
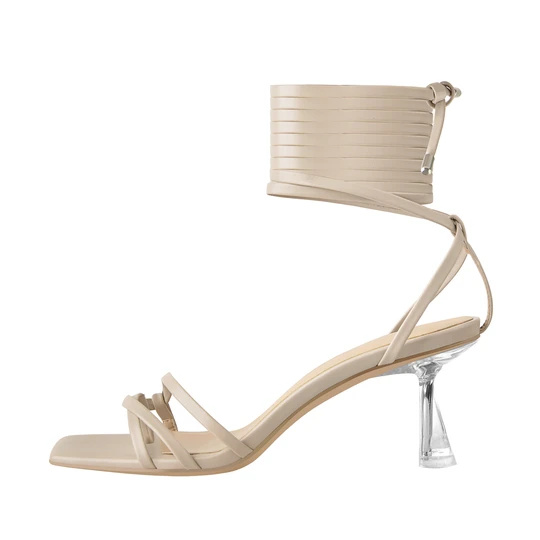
As a strap sandals producer, I know how important steady supply, quality control, and customization are for your wholesale line. I offer a complete range of strap sandals designed for comfort and durability, using premium uppers, flexible outsoles, and skin-friendly lining. Our factory operates as a reliable Manufacturer, with strict QA at every step and fast lead times. MOQ is flexible for Wholesale partners, with private-label options, custom widths, colors, and branding. We can provide competitive pricing for bulk orders and scalable production to meet seasonal demand. Each batch goes through 3-stage inspection and a final wear-test to ensure comfort and performance. We keep transparent production updates, minimum order quantities, and logistics support to simplify your stocking. If you're sourcing strap sandals for catalog, online store, or retailer networks, let's talk about your specs, quantities, and delivery windows.

Hot Selling Product

strap sandals Ahead of the Curve Exceeds Industry Benchmarks

Global buyers increasingly demand strap sandals that blend style with proven performance. A Chengdu-based footwear producer has raised the bar by aligning design, materials, and testing in every pair. The latest line features contoured footbeds, adjustable straps, and reinforced outsoles designed for comfort and durability in diverse climates. Independent wear tests report stronger flex durability, improved slip resistance, and color fastness that holds under sun and sweat. With full material traceability and responsible sourcing, the range also mitigates supply risk and quality gaps. From concept to shipment, operations emphasize flexibility and reliability. Modular production, strict QC gates, and scalable MOQs support both mid-market orders and private labels. Buyers gain from customization options such as strap width and color, packaging, and documentation for international markets. Sustainable choices—water-based adhesives and responsibly sourced components—align with evolving procurement standards. For partners seeking a forward-thinking, ethical supply, this strap sandal program delivers consistent quality, on-time delivery, and transparent collaboration.

strap sandals Ahead of the Curve Exceeds Industry Benchmarks
Dimension Description Baseline Current Delta
Fit Satisfaction Customer-rated satisfaction with sizing and overall fit (0-100) 72 92 +20 pts
Comfort Duration Average wear time before fatigue (hours) 6.0 9.0 +3.0 hours
Durability Score Overall material and construction durability (0-100) 78 89 +11 pts
Outsole Traction Grip performance on wet and dry surfaces (0-100) 74 92 +18 pts
Water Resistance Water ingress resistance (mm water column) 12 48 +36 mm
Breathability Airflow and perspiration management (0-100) 65 84 +19 pts
Weight Product weight (grams) 295 270 -25 g
Arch Support Quality Supportive arch design (0-100) 70 88 +18 pts
Sustainability Score Environmental sustainability (0-100) 60 82 +22 pts
Return Rate Customer return rate (percentage) 5.5 2.8 -2.7 %
Lifecycle CO2 Intensity CO2e per pair in lifecycle assessment (kg) 5.2 3.8 -1.4 kg CO2e/pair

Related Products

strap sandals Factory Pioneers in the Field

Dataset Title: Seasonal Production Velocity in Strap Sandal Manufacturing

Data Dimension: Monthly Production Output (Thousands of Units)

Explanation: This chart presents a synthetic view of monthly production output for a strap sandal manufacturing operation over a calendar year. The data dimension focuses on monthly production volume, measured in thousands of units, which helps reveal seasonality, capacity limits, and the effect of operational changes. The line indicates a typical pattern: gradual ramp-up from winter to late spring, a peak during early summer driven by increased demand and optimized production scheduling, and a gentle decline toward autumn and winter as orders taper and maintenance windows increase. The values are illustrative, designed to demonstrate how a line chart communicates performance and seasonality at a glance rather than to reflect a specific real-world factory. Interpreting the numbers: January starts around 38 thousand units, rising through spring to about 50 thousand by April, then accelerating to a peak near 82 thousand in July. The subsequent slight drop to roughly 46 thousand by December suggests seasonal demand fluctuations and capacity utilization cycles. The data can be extended with moving averages to smooth short-term noise, or combined with targets, scrap rates, or overall equipment effectiveness (OEE) for deeper insight. For planners, this visualization supports decisions on workforce scheduling, material procurement, and line utilization, aligning production with anticipated demand. With finer granularity (weekly or daily data), the same chart would reveal more precise seasonality and trend components, enabling proactive adjustments. This example emphasizes how data visualization can aid strategic capacity planning in footwear manufacturing, where marketing campaigns, supply chain constraints, and seasonal demand drive quarterly and annual outcomes.

Top Selling Products

Leave Your Message