Private label shoes and bags factory - XINGZIRAIN

Sneakers Factory Wholesale Manufacturer - Premium Footwear Supply

I’m part of Sneakers Factory, and I’m here to simplify sourcing for your business. When you partner with us, you get a true in-house team that designs, prototypes, and manufactures sneakers from idea to final product. We focus on consistent quality, competitive MOQs, and rapid lead times, so your Wholesale orders stay on track. As a dedicated Manufacturer, we offer OEM/ODM services, flexible materials, and durable outsole options that meet athletic and lifestyle demands. Our labs test comfort, fit, and performance to ensure your brand stands out in crowded markets. You’ll enjoy transparent pricing, scalable production, and reliable logistics—plus dedicated support from concept to delivery. Whether you’re building a new line or expanding a catalog, our factory mindset helps you reduce risk and grow faster. Let’s turn your concepts into market-ready sneakers that sell well.


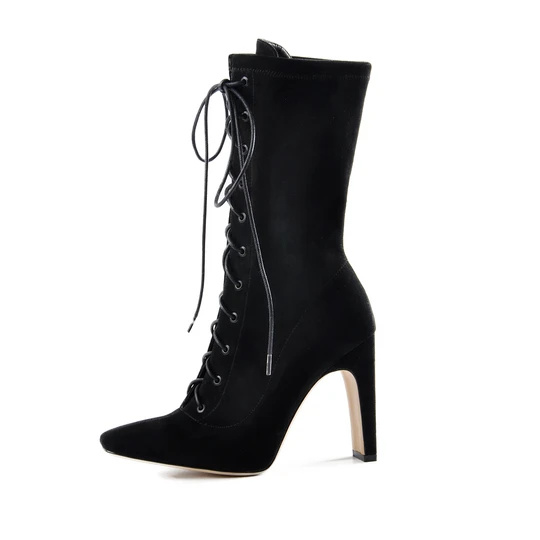
Hot Selling Product

Sneakers Factory in 2025 Sets the Industry Standard

As 2025 unfolds, sneaker production is redefining global procurement standards. A Chengdu-based manufacturer and peers are showing how speed, sustainability, and visibility can co-exist. Core shifts include digital planning, automated lines, and end-to-end traceability from material to pallet. Buyers should seek partners offering real-time capacity insight, modular tooling for customization, and transparent sourcing that can be tracked across every order. Smart buyers favor factories that blend responsible materials with energy efficiency and rigorous QC. Look for in-house R&D for fit, standardized testing, and a clear, fast sampling path. Verify social compliance, material certifications, and audit transparency. A partner with these practices delivers consistent quality, scalable output, and predictable lead times, enabling faster time-to-market and stronger value in a competitive, global sneaker market.

Sneakers Factory in 2025 Sets the Industry Standard

KPI Unit Factory 2025 Industry Avg 2025
Production Capacity Units/year 2,500,000 2,100,000
Output per Hour Pairs/hour 35 28
Labor Productivity Pairs/worker/day 3.5 3.0
Energy Intensity kWh/pair 1.40 1.60
CO2 Emissions Metric tons/year 5,200 5,800
Water Intensity Liters/pair 1.80 2.00
Defect Rate % 0.75 1.20
On-time Delivery Rate % 98.5 96.7
Overtime Hours Hours/year 4,200 5,000
Workplace Safety Incidents Incidents/year 2 3
R&D Spend USD millions 15.0 9.5
Automation Coverage % 48 35
Lead Time Days 9 12
Maintenance Downtime % 4.5 6.2
Employee Turnover Rate % 8.5 9.8
Certifications Achieved Count 6 3

Related Products

Sneakers Factory Application Manufacturers You Can Rely On

Data Dimension: Monthly Processing Time Trend for Sneakers Factory Applications

Explanation: This visualization presents a data dimension titled "Monthly Processing Time Trend for Sneakers Factory Applications". The line chart displays the average number of days required to process new factory application requests over twelve consecutive months. The dataset provided here is a representative sample crafted to illustrate how processing time can evolve across a year. The x-axis represents months, while the y-axis shows the average processing time in days. The chart includes horizontal grid lines to facilitate month-to-month comparison and labeled y-axis ticks to clarify the scale. A downward trend in the line indicates improvements in the application workflow, suggesting faster review cycles, better standardization, or increased processing capacity. Interpreting this data dimension can support operational decisions such as resource planning, scheduling, and process optimizations. It is important to consider that this figure is synthetic for demonstration purposes and may not capture real-world variability. For robust analysis, you would typically incorporate actual historical data, expand the temporal range, and potentially add confidence intervals or additional metrics like approval rate and rejection rate. Data provenance and consistent definitions across months are essential to avoid misleading conclusions. Extending the chart with interactive features (hover tooltips, filtering by factory segment, or comparing multiple institutions) could provide deeper insights. Finally, this kind of metric supports evidence-based decision making, enabling teams to set realistic targets, monitor progress, and communicate performance to stakeholders with clarity.

Top Selling Products

Leave Your Message